
Select the relevant link below to navigate to a specific desired section or continue reading the full content:
- Age on entry
- Disability Profile
- Domicile
- Ethnicity
- Gender
- Widening Participation
- Student Performance
Student Profile data
Our student profile information shows data relating to students enrolled at Northumbria University in the 2024/25 academic year. This data includes all full-time students studying at our Newcastle campus. Numbers have been rounded to the nearest 5 and suppressed when below 5.
Age on Entry Profile
The age on entry profile of our students differs by the level of study and is typical of the sector with many UG students joining Northumbria straight from sixth form/college aged 18. By contrast over 43% of our PGT students in 2024/25 were aged 25 and above at the point of entry.
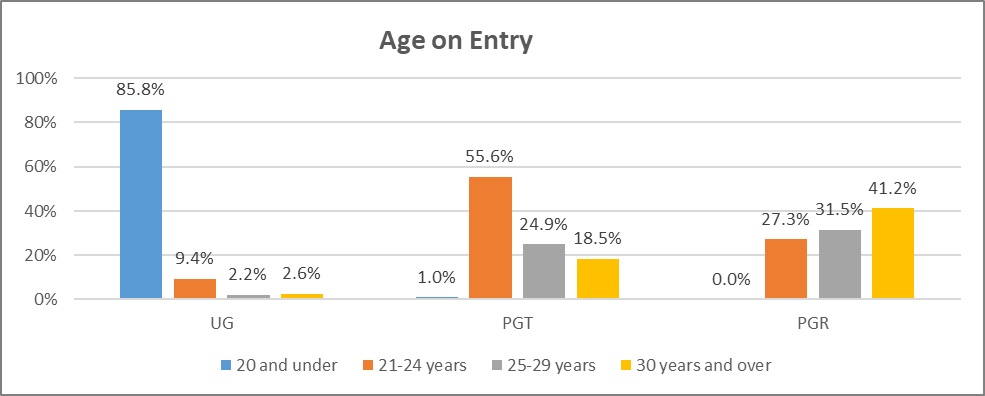
| Age on Entry | UG | PGT | PGR |
| 20 and under | 14,645 | 25 | - |
| 21-24 years | 1,610 | 1,325 | 190 |
| 25-29 years | 370 | 595 | 215 |
| 30 years and over | 440 | 440 | 280 |
Alt text: The table and chart show the distribution of full-time Newcastle campus students in 2024/25 split by study level and age on entry band. At UG level, students aged 20 and under on entry had a headcount of 14,645 (85.8%), those aged 21-24 years had a headcount of 1,610 (9.4%), those aged 25-29 years had a headcount of 370 (2.2%), and those 30 years and over had a headcount of 440 (2.6%). At PGT level, students aged 20 and under on entry had a headcount of 25 (1.0%), those aged 21-24 years had a headcount of 1,325 (55.6%), those aged 25-29 years had a headcount of 595 (24.9%), and those 30 years and over had a headcount of 440 (18.5%). At PGR level, students aged 21-24 years on entry had a headcount of 190 (27.3%), those aged 25-29 years had a headcount of 215 (31.5%), and those 30 years and over had a headcount of 280 (41.2%).
Disability Profile
We collect detailed student disability data which includes details of mental health conditions, learning difficulties, physical impairments and social, behavioural and communication impairments to ensure we can target our student support most effectively. The aggregate data presented below shows that 20.9% of Northumbria’s FT UG student body had a known disability in 2024/25. The latest sector data relates to 2023/24 and shows that the figure across the sector was 19.9% (HEIDI Plus Student FPE 2023/24). Northumbria also has a higher proportion of students with a known disability at PGT level (10.3% vs 2023/24 sector 8.5%) and at PGR level (23.2% vs 2023/24 sector 16.8%).
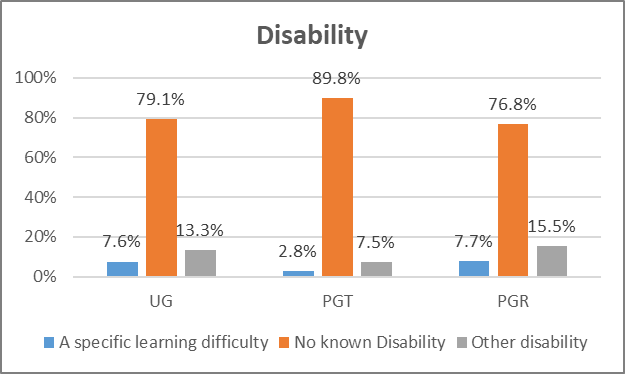
| Disability | UG | PGT | PGR |
| No known disability | 13,490 | 2,135 | 525 |
| A specific learning difficulty | 1,300 | 65 | 55 |
| Other disability | 2,270 | 180 | 105 |
Alt text: The table and chart show the distribution of full-time Newcastle campus students in 2024/25 split by study level and disability category. At UG level, students with no known disability had a headcount of 13,490 (79.1%), those with a specific learning difficulty had a headcount of 1,300 (7.6%) and those with another disability had a headcount of 2,270 (13.3%). At PGT level, students with no known disability had a headcount of 2,135 (89.8%), those with a specific learning difficulty had a headcount of 65 (2.8%) and those with another disability had a headcount of 180 (7.5%). At PGR level, students with no known disability had a headcount of 525 (76.8%), those with a specific learning difficulty had a headcount of 55 (7.7%) and those with another disability had a headcount of 105 (15.5%).
Domicile
In addition to our Newcastle Campus, Northumbria has a London Campus and multiple Transnational Education Partners, overall making up a diverse student body with over 10,500 international students from c.140 countries. The table and graph below show the domicile split for Newcastle Campus. The domicile split between the different study levels is very different with our large UG cohort including over 90% of students from the UK. Within this UK cohort, 60% of students come from the North East of England (HEIDI Plus; Student FPE 2023/24) indicating our strong regional presence. At PGT and PGR levels, we have a much stronger international presence with large intakes from countries such as India, Nigeria, Malaysia, Sri Lanka and Pakistan who made up our 5 largest cohorts from outside the UK at PGT level.
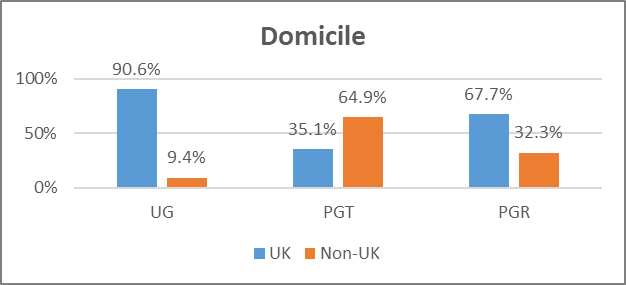
| Domicile | UG | PGT | PGR |
| UK | 15,465 | 835 | 465 |
|
Non-UK |
1,600 | 1,545 | 220 |
Alt text: The table and chart show the distribution of full-time Newcastle campus students in 2024/25 split by study level and domicile. At UG level, UK domiciled students had a headcount of 15,465 (90.6%) and those with a non-UK domicile had a headcount of 1,600 (9.4%). At PGT level, UK domiciled students had a headcount of 835 (35.1%) and those with a non-UK domicile had a headcount of 1,545 (64.9%). At PGR level, UK domiciled students had a headcount of 465 (67.7%) and those with a non-UK domicile had a headcount of 220 (32.3%).
Ethnicity
The Ethnicity splits shown below are shaped by the domicile split described above with higher proportions of BAME students at PGT and PGR level and the proportions at UG level are influenced by the North East region’s demographics. For example, the population of black UK students at Northumbria is small when compared to the sector but this is due in part to the demographics of the North East region and the strong regional profile of Northumbria’s UG intake. 3.3% of FT UK UG students at Northumbria in 2024/25 were black compared to an UK provider average of 9.3% (HEIDI Plus; Student FPE 2023/24). Official census and labour market statistics show that only 1.5% of people aged between 16 and 64 in the North East were black in the census period July 2021 to June 2022.
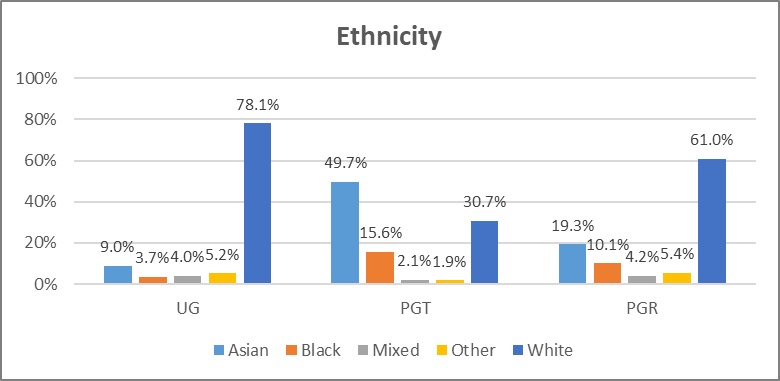
| Ethnicity | UG | PGT | PGR |
| White | 13,225 | 725 | 410 |
| Black | 625 | 370 | 70 |
| Asian | 1,520 | 1,170 | 130 |
| Other | 875 | 45 | 35 |
| Mixed | 685 | 50 | 30 |
Alt text: The table and chart show the distribution of full-time Newcastle campus students in 2024/25 split by study level and ethnicity. At UG level, white students had a headcount of 13,225 (78.1%), black students had a headcount of 625 (3.7%), Asian students had a headcount of 1,520 (9.0%), mixed ethnicity students had a headcount of 685 (4.0%), and other ethnicity students had a headcount of 875 (5.2%). At PGT level, white students had a headcount of 725 (30.7%), black students had a headcount of 370 (15.6%), Asian students had a headcount of 1,170 (49.7%), mixed ethnicity students had a headcount of 50 (2.1%), and other ethnicity students had a headcount of 45 (1.9%). At PGR level, white students had a headcount of 410 (61.0%), black students had a headcount of 70 (10.1%), Asian students had a headcount of 130 (19.3%), mixed ethnicity students had a headcount of 30 (4.2%), and other ethnicity students had a headcount of 35 (5.4%).
Gender
The gender split of the student population at Northumbria is similar to that of the UK HE sector with 55.1% of our full-time UG students in 2024/25 being female compared to 55.9% in the sector (HEIDI Plus Student FPE 2023/24). At PGT level, there is some variation with females making up 48.6% of the student population compared to 54.3% across the sector.
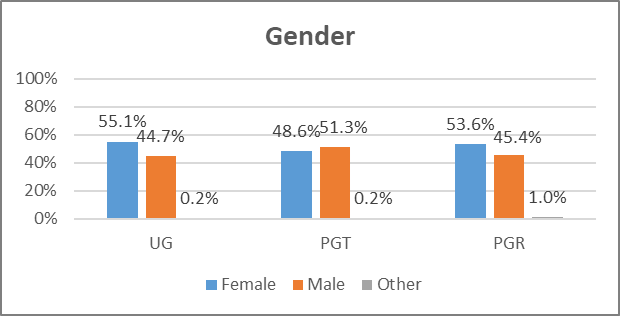
| Gender | UG | PGT | PGR |
| Male | 7,615 | 1,220 | 310 |
| Female | 9,385 | 1,155 | 365 |
| Other | 40 | - | 5 |
Alt text: The table and chart show the distribution of full-time Newcastle campus students in 2024/25 split by study level and gender. At UG level, female students had a headcount of 9,385 (55.1%) and male students had a headcount of 7,615 (44.7%). At PGT level, female students had a headcount of 1,155 (48.6%) and male students had a headcount of 1,220 (51.3%). At PGR level, female students had a headcount of 365 (53.6%) and male students had a headcount of 310 (45.4%).
Widening Participation
Northumbria is proud to be a successful Widening Participation (WP) Institution, with a high proportion of students coming from widening participation backgrounds. In semester one 2024/25, 69.4% of eligible students completed our diversity monitoring enrolment form. Of those who completed the form, 88.6% (20,125) self-identified as belonging to one or more WP groups (including those who identify as Black, Asian or Minority Ethnic, Care Leaver, Commuter Student, Disabled, Estranged, First-Generation, Eligible for Free School Meals, Gypsy, Roma and Traveller Communities, LGBTQ+, Low Participation Neighbourhoods, Mature Student, Military Background, Sanctuary Scholar or Young Carer).
Diversity Monitoring data is used as a starting point for further, meaningful conversations with staff and students. This data is used to provide new insights and monitor and evaluate our activity, rather than to put students into boxes. Data is disaggregated as much as possible, and we acknowledge that intersectionality and individual student experiences are important considerations. However, there are benefits for core business in collecting diversity data which include attracting buy in to work. We have introduced a Diversity Monitoring Dashboard to allow key stakeholders to view data in an informative and user-friendly way.
Student Performance
We continually analyse and evaluate student performance through an EDI lens on metrics across the student lifecycle including Access rates, Continuation (the proportion of new entrants who remain in HE one year after enrolment), Completion (the proportion of new entrants who go on to complete their qualification) and Progression (the proportion of graduates who go into skilled employment or further study).
A key part of this work is identifying areas where there are gaps in performance and setting targets to close gaps with appropriate interventions put in place to enable the closing of the gaps. This work is captured as part of the university’s Access and Participation Plan which was approved by the Office for Students in October 2023 and covers the period 2024/25 to 2027/28.
Return to main EDI Report page.
Latest News and Features
Northumbria University research unlocks the secrets of Vivienne Westwood's craft in a major new exhibition
A fashion researcher and educator from Northumbria University has created what is believed…
NESST topping out ceremony attendees receive traditional tankards to celebrate build milestone
Topping out ceremony marks pivotal moment for centre backed by £50 million investment set to…
From Netflix to Newcastle Northumbria graduate uses AI to revolutionise film and TV production
A Northumbria University graduate who co-created Bangkok Breaking — one of Thailand's biggest…

Northumbria University researcher brings death-positive arts festival to libraries across England
An arts festival exploring death, dying and end-of-life choices — led by a Northumbria University…
Northumbria University spinout achieves CE marking for deep lung breath sampling device — a first backed by peer-reviewed research
A medical device company spun out of Northumbria University has reached a significant milestone…
Northumbria University's IT recycling initiative recognised as national best practice
The equivalent weight of one and a half double-decker buses' worth of IT equipment has been…
Scientists solve decades-long mystery about why Saturn appears to change its spin
Researchers at Northumbria University have used the most powerful space telescope ever built…
Northumbria University professor named among UK's most outstanding health and care research leaders
A Northumbria University professor has been appointed as one of the UK's most influential health…
More events
Upcoming events

From sustenance to complete nourishment in a changing and uncertain climate
Ellison Building A, 001 (ELA 001)
-

Broken Bonds: New Perspectives on Marital Breakdown
The Great Hall
-

Smarter Supply Chains: Digital Innovation for Cost, Efficiency & Carbon
Northumbria University
-

Culture in Conversation: Rethinking Leadership & Organisational Practice
CCE1 Newcastle Business School
-
