Northumbria University and England Football Learning launch strategic partnership
Northumbria’s transformative strategic partnership with England Football Learning, the education…

Select the relevant link below to navigate to a specific desired section or continue reading the full content:
This page contains multiple images, graphics and charts, full alternative text for all of the contents of the page are available on this dedicated page.
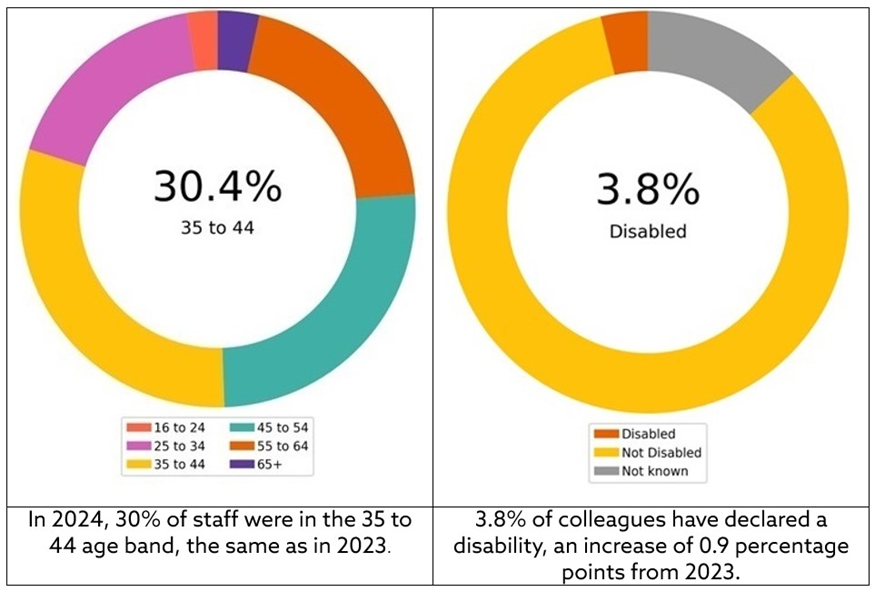
Our staff profile information was generated at a data point of 31 March 2024. In previous reports we have used a data point of 31 July to align with our student data reporting period, from this year we have aligned our staff data point with the statutory reporting date for Pay Gap reporting.
Our workforce headcount on 31 March 2024 was 3551. The tables presented are in line with our obligation to publish information under the Public Sector Equality Duty (PSED). Northumbria' s headcount has decreased by 2.6% in the 8-month period, since the last reported figure. This is a reduction in headcount of 94.
Our workforce has seen changes in diversity since the 2023 report. Our data shows that female headcount has decreased by 2.7%, whereas male headcount has
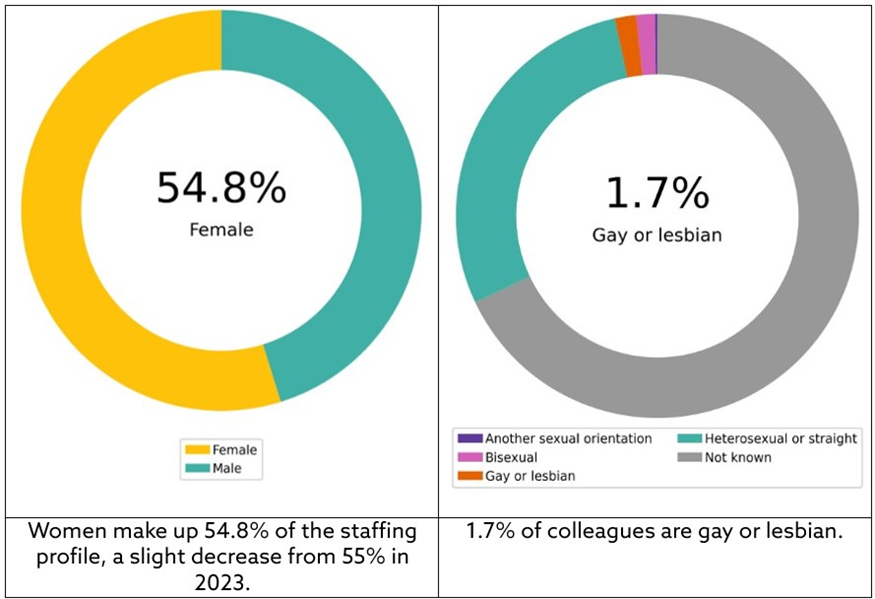
decreased by 2.4%. Our overall workforce is now 54.8% female and 45.2% male, a slight shift from the previous year's 54.9% female and 45.1% male. Academic headcount has decreased by 3.4% since 2023, whereas Professional Support has seen a decrease of 1.9%.
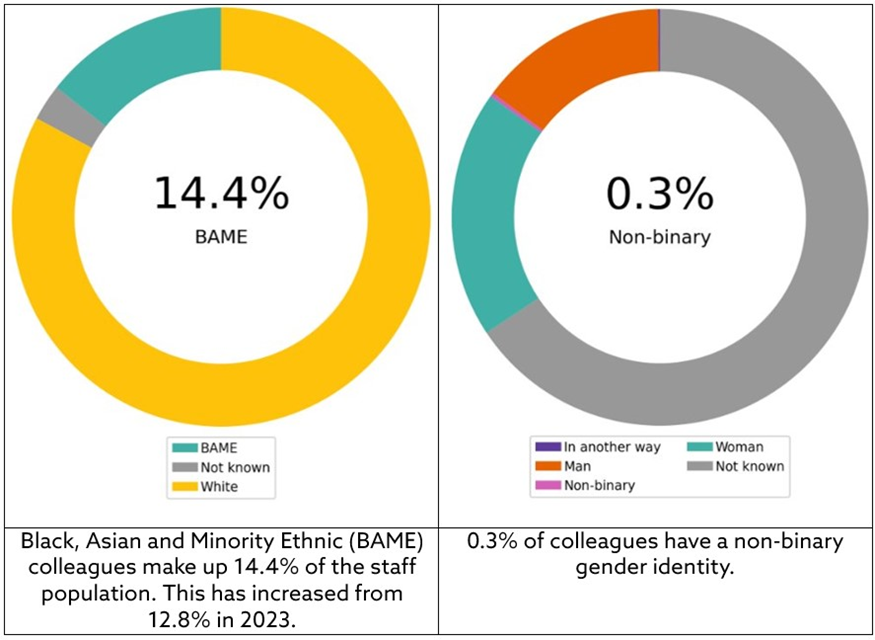
The BAME headcount has increased by 9.6%, from 468 to 513, while the White headcount has decreased by 2.1%, from 3003 to 2940. This represents a significant increase in diversity, with BAME staff now comprising 14.4% of the workforce, up from 12.8% in the previous year.
The number of staff reporting a disability has increased substantially, from 106 to 136, representing a 28.3% increase. This brings the proportion of disabled staff from 2.9% to 3.8% of the total workforce.
Employee Type |
Headcount |
Headcount % |
FTE |
FTE % |
|
Academic |
1673 |
47.1 |
1596.5 |
49 |
|
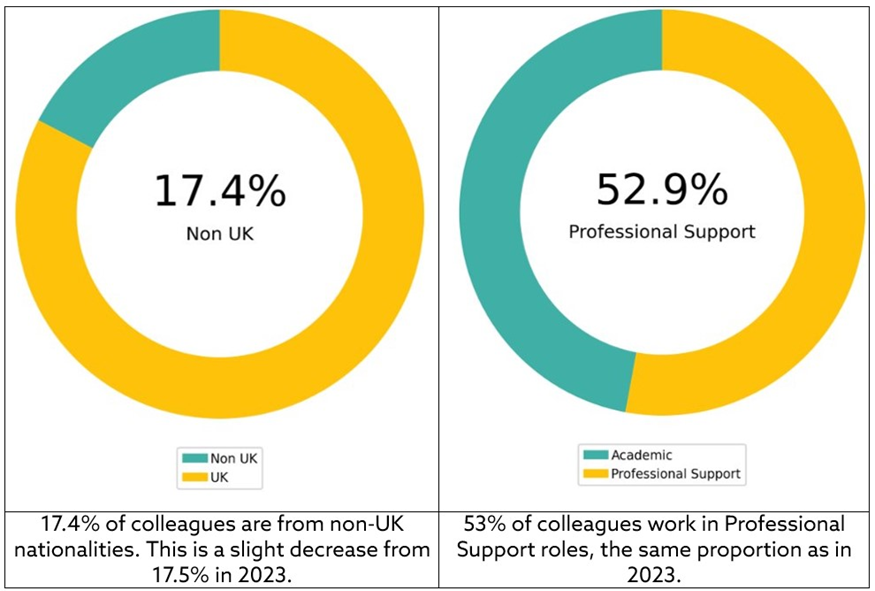
Professional Support |
1878 |
52.9 |
1660.1 |
51 |
|
Total |
3551 |
100 |
3256.6 |
100 |
Age Band |
Headcount |
Headcount % |
FTE |
FTE % |
|
16 to 24 |
93 |
2.6 |
80.9 |
2.5 |
|
25 to 34 |
626 |
17.6 |
590.8 |
18.1 |
|
35 to 44 |
1078 |
30.4 |
1012.7 |
31.1 |
|
45 to 54 |
908 |
25.6 |
859.5 |
26.4 |
|
55 to 64 |
724 |
20.4 |
630.2 |
19.4 |
|
65+ |
122 |
3.4 |
82.5 |
2.5 |
|
Total |
3551 |
100 |
3256.6 |
100 |
Sex
Gender |
Headcount |
Headcount % |
FTE |
FTE % |
|
Female |
1946 |
54.8 |
1722.1 |
52.9 |
|
Male |
1605 |
45.2 |
1534.4 |
47.1 |
|
Total |
3551 |
100 |
3256.6 |
100 |
Ethnicity |
Headcount |
Headcount % |
FTE |
FTE % |
|
BAME |
513 |
14.4 |
484.1 |
14.9 |
|
Not known
|
98 |
2.8 |
88.3 |
2.7 |
|
White
|
2940 |
82.8 |
2684.2 |
82.4 |
|
Total |
3551 |
100 |
3256.6 |
100 |
Disability |
Headcount |
Headcount % |
FTE |
FTE % |
|
Disabled |
136 |
3.8 |
127.8 |
3.9 |
|
Not Disabled |
2931 |
82.5 |
2698.2 |
82.9 |
|
Not known |
484 |
13.6 |
430.6 |
13.2 |
|
Total |
3551 |
100 |
3256.6 |
100 |
Nationality |
Headcount |
Headcount % |
FTE |
FTE % |
|
EU |
228 |
6.4 |
217.1 |
6.7 |
|
Europe (Non-EU) |
10 |
0.3 |
10 |
0.3 |
|
International |
381 |
10.7 |
369.9 |
11.4 |
|
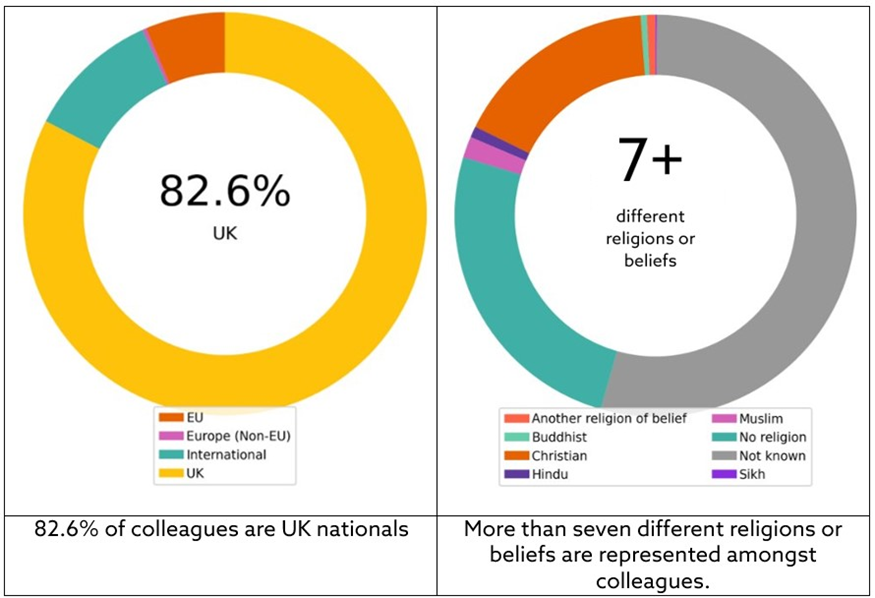
UK |
2932 |
82.6 |
2659.6 |
81.7 |
|
Total |
3551 |
100 |
3256.6 |
100 |
Gender Identity |
Headcount |
Headcount % |
FTE |
FTE % |
|
In another way |
5 |
0.1 |
4.5 |
0.1 |
|
Man |
505 |
14.2 |
484.4 |
14.9 |
|
Non-binary |
11 |
0.3 |
10.3 |
0.3 |
|
Not known |
681 |
19.2 |
622.5 |
19.1 |
|
Woman |
2349 |
66.2 |
2134.8 |
65.6 |
|
Total |
3551 |
100 |
3256.6 |
100 |
Sexual Orientation |
Headcount |
Headcount % |
FTE |
FTE % |
|
Another sexual orientation |
8 |
0.2 |
7.5 |
0.2 |
|
Bisexual |
54 |
1.5 |
51.5 |
1.6 |
|
Gay or lesbian |
62 |
1.7 |
60.4 |
1.9 |
|
Heterosexual or straight |
1015 |
28.6 |
944 |
29 |
|
Not known |
2412 |
67.9 |
2193.1 |
67.3 |
|
Total |
3551 |
100 |
3256.6 |
100 |
Religion |
Headcount |
Headcount % |
FTE |
FTE % |
|
Another religion or belief |
24 |
0.7 |
22.2 |
0.7 |
|
Buddhist |
16 |
0.5 |
16 |
0.5 |
|
Christian |
586 |
16.5 |
537.7 |
16.5 |
|
Hindu |
31 |
0.9 |
31 |
1 |
|
Muslim |
62 |
1.7 |
59.2 |
1.8 |
|
No religion |
900 |
25.3 |
840.8 |
25.8 |
|
Not Known |
1928 |
54.3 |
1746 |
53.6 |
|
Sikh |
4 |
0.1 |
3.6 |
0.1 |
|
Total |
3551 |
100 |
3256.6 |
100 |
In terms of recruitment, there has been a decrease in both academic and professional support starters. Academic recruitment has decreased by 49.8%, from 247 to 124 new starters. Professional support recruitment has also decreased, by 41.8%, from 467 to 297 new starters.
Gender
Gender |
Headcount |
Headcount % |
FTE |
FTE % |
|
Female |
57 |
46 |
55.1 |
45.6 |
|
Male |
67 |
54 |
65.8 |
54.4 |
|
Total |
124 |
100 |
120.9 |
100 |
Ethnicity
Ethnicity |
Headcount |
Headcount % |
FTE |
FTE % |
|
BAME |
48 |
38.7 |
47.6 |
39.4 |
|
White |
72 |
58.1 |
69.3 |
57.3 |
|
Not known |
4 |
3.2 |
4 |
3.3 |
|
Total |
124 |
100 |
120.9 |
100 |
Disability
Disability |
Headcount |
Headcount % |
FTE |
FTE % |
|
Disabled |
6 |
4.8 |
6 |
5 |
|
Not Disabled |
3 |
2.4 |
3 |
2.5 |
|
Not known |
115 |
92.7 |
111.9 |
92.6 |
|
Total |
124 |
100 |
120.9 |
100 |
Gender
Gender |
Headcount |
Headcount % |
FTE |
FTE % |
|
Female |
109 |
63 |
96.1 |
62.2 |
|
Male |
64 |
37 |
58.4 |
37.8 |
|
Total |
173 |
100 |
154.4 |
100 |
Ethnicity
Ethnicity |
Headcount |
Headcount % |
FTE |
FTE % |
|
BAME |
76 |
25.6 |
71.7 |
26 |
|
White |
214 |
72.1 |
197.5 |
71.7 |
|
Not known |
7 |
2.4 |
6.2 |
2.2 |
|
Total |
297 |
100 |
275.3 |
100 |
Disability
Disability |
Headcount |
Headcount % |
FTE |
FTE % |
|
Disabled |
22 |
7.4 |
21 |
7.6 |
|
Not Disabled |
17 |
5.7 |
15.2 |
5.5 |
|
Not known |
258 |
86.9 |
239.1 |
86.8 |
|
Total |
297 |
100 |
275.3 |
100 |
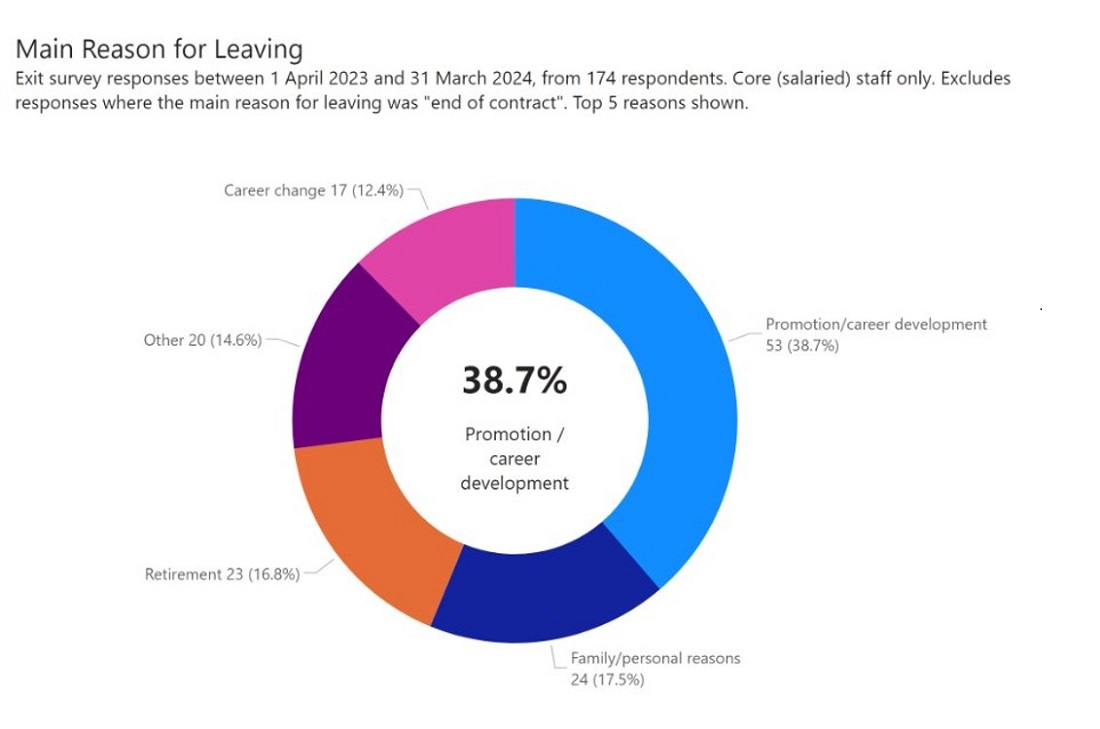
There has been an increase in both academic and professional support departures. Academic leavers have increased by 26.0%, from 174 to 219. Professional support leavers have seen a smaller increase of 4.8%, from 252 to 264.
These figures show a slight contraction in overall staff numbers, but with increases in diversity, particularly in terms of BAME representation and disability disclosure.
Gender
Gender |
Headcount |
Headcount % |
FTE |
FTE % |
|
Female |
106 |
48.4 |
94.1 |
48 |
|
Male |
113 |
51.6 |
102.1 |
52 |
|
Total |
219 |
100 |
196.2 |
100 |
Ethnicity
Ethnicity |
Headcount |
Headcount % |
FTE |
FTE % |
|
BAME |
51 |
23.3 |
48 |
24.5 |
|
White |
161 |
73.5 |
141.6 |
72.2 |
|
Not known |
7 |
3.2 |
6.6 |
3.4 |
|
Total |
219 |
100 |
196.2 |
100 |
Disability
Disability |
Headcount |
Headcount % |
FTE |
FTE % |
|
Disabled |
4 |
1.8 |
3.6 |
1.8 |
|
Not Disabled |
193 |
88.1 |
174.1 |
88.7 |
|
Not known |
22 |
10 |
18.5 |
9.4 |
|
Total |
219 |
100 |
196.2 |
100 |
Gender
Gender |
Headcount |
Headcount % |
FTE |
FTE % |
|
Female |
179 |
67.8 |
149.8 |
64.7 |
|
Male |
85 |
32.2 |
81.8 |
35.3 |
|
Total |
264 |
100 |
231.6 |
100 |
Ethnicity
Ethnicity |
Headcount |
Headcount % |
FTE |
FTE % |
|
BAME |
29 |
11 |
24.6 |
10.6 |
|
Not known |
8 |
3 |
6.9 |
3 |
|
White |
227 |
86 |
200.1 |
86.4 |
|
Total |
264 |
100 |
231.6 |
100 |
Disability
Disability |
Headcount |
Headcount % |
FTE |
FTE % |
|
Disabled |
9 |
3.4 |
7 |
3 |
|
Not Disabled |
207 |
78.4 |
184.7 |
79.8 |
|
Not known |
48 |
18.2 |
39.8 |
17.2 |
|
Total |
264 |
100 |
231.6 |
100 |
Pay Gap |
Median % |
Mean % |
|
Gender |
15.3 |
13.7 |
|
Ethnicity (White/BAME) |
-3.9 |
1.6 |
|
Disability |
13.3 |
11.0 |
The statutory reporting deadline for the Gender Pay Gap was 4th April 2024, using the 2023 ‘snapshot’ date.
The median Gender Pay Gap increased slightly to 15.3% in 2023 from 15.2% in 2022. The mean gap increased to 13.7% from 11.4%. This reflects changes in the proportions of men and women in pay quartiles, and the difference between median Professional Support pay (£15.28) and median Academic pay (£28.19).
The median Ethnicity Pay Gap remained negative at -3.9%, indicating higher median pay for employees from Black, Asian and Minority Ethnic backgrounds (BAME) compared to White employees. The mean gap decreased to 1.6% from 7.7% in 2022. This is reflected in a reduction in BAME employees in the lowest pay quartile and an increase in the highest quartile.
The median Disability Pay Gap decreased to 13.3% from 15.8% in 2022, while the mean gap increased slightly to 11.0% from 10.6%. The proportion of full-pay relevant employees disclosed as Disabled increased to 3.4% (123) in 2023 from 2.5% (79) in 2021.
The University and Colleges Employers Association (UCEA) conducted a Pay Gaps survey in 2023 for sector benchmarking. Northumbria University's 2022 median Gender Pay Gap (15.2%) was higher than the sector (12.3%) and national (14.4%) medians. The median Ethnicity Pay Gap (-4.5%) was lower than the sector's (2.6%).
The University recognises that addressing pay gaps requires sustained changes in practice and cultural norms. Priorities include increasing women in senior grades, improving ethnic representation across all grades, and increasing disability disclosure rates. Actions taken include embedding EDI into recruitment policies, providing development opportunities for underrepresented groups, enhancing maternity and paternity provisions, and regular reviews of pay equity. The University is committed to pursuing the elimination of median pay gaps by gender, ethnicity, and disability as part of its 2030 Strategy. A review of EDI actions across relevant charters and commitments will be undertaken, with progress monitored and shared regularly.
In addition to monitoring our year-on-year data, which allows us to identify trends and measure the effectiveness of steps we are taking to improve the diversity of our workforce, we also look externally to the region and sector using publicly available data provided by HESA (Higher Education Statistics Agency).
This report uses the latest available HESA published data with a census date of 01 December 2023. Whilst this is not as recent as the data referenced elsewhere in this report (31 March 2024), it provides insight into our position in comparison to the sector during the reporting period.
In terms of the size of the workforce, Newcastle University remains the largest in the region with 6,635 staff, followed by Durham University at 5,450. Northumbria sits in the middle with 3,551 staff, ahead of Sunderland University (2,390) and Teesside University (2,070).
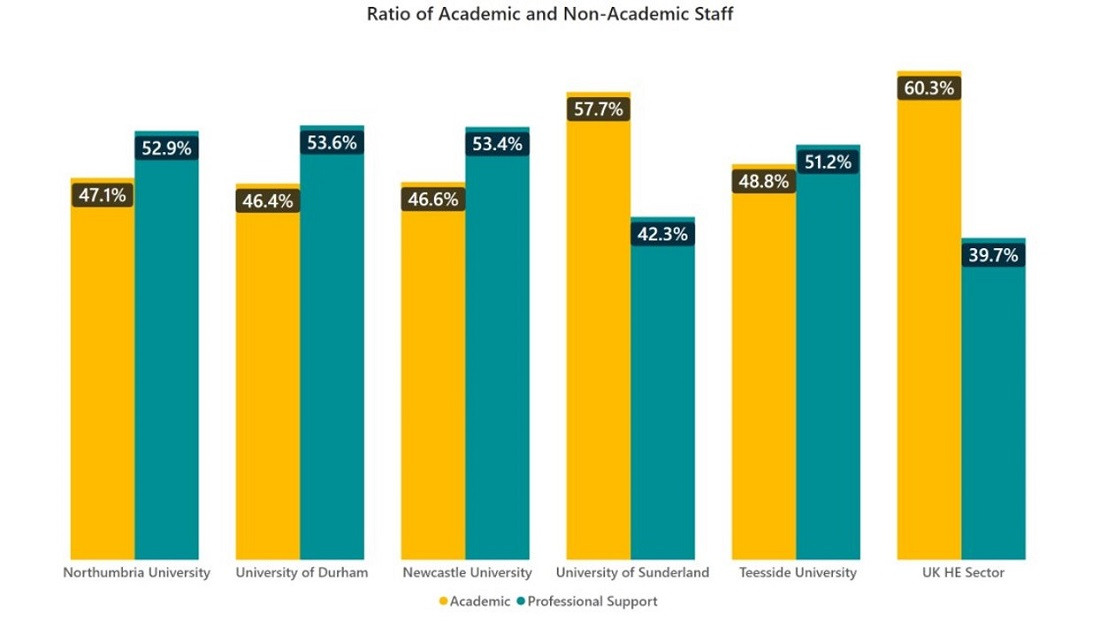
Our proportion of academic staff is 47.1%, below the sector average. In a regional context, the proportion of academic staff is higher at Sunderland University (57.7%) and slightly lower at Durham University (46.4%) and Newcastle University (46.6%). Northumbria remains competitive in terms of its academic and professional support staff balance, positioning us within the middle of the region’s universities.
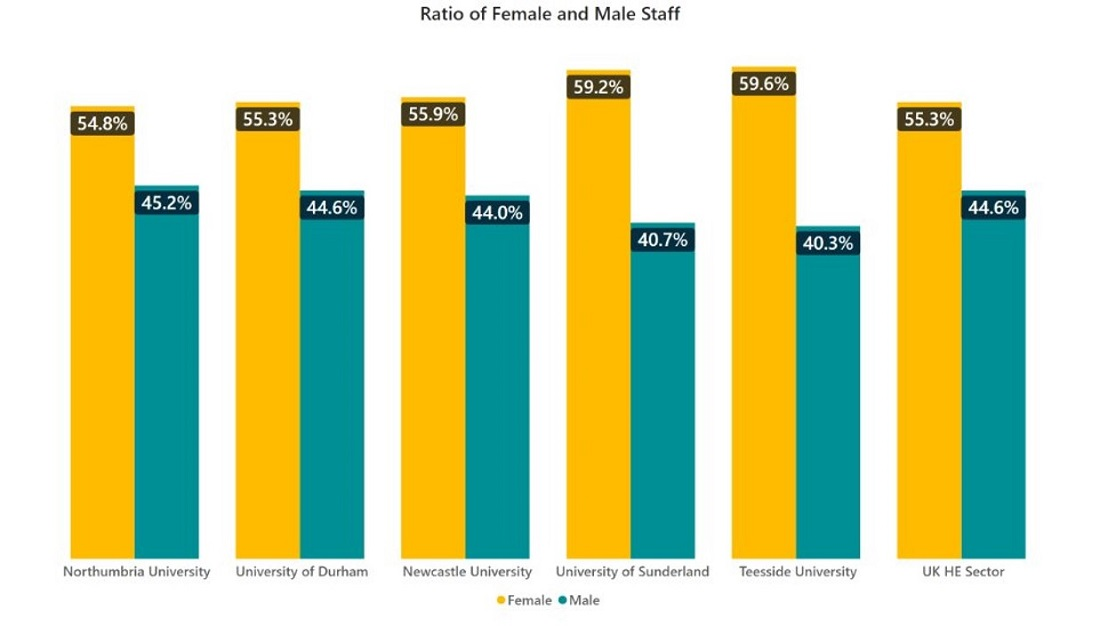
Northumbria’s workforce gender distribution is now 54.8% female and 45.2% male, showing a slight increase in female representation from last year’s 53.4% female and 46.6% male. While we continue to have the lowest proportion of female staff among regional universities, we are now more closely aligned with sector trends. In comparison, Teesside University has the highest female representation at 59.6%, followed by Sunderland at 59.2%. The national sector average is 55.0% female.
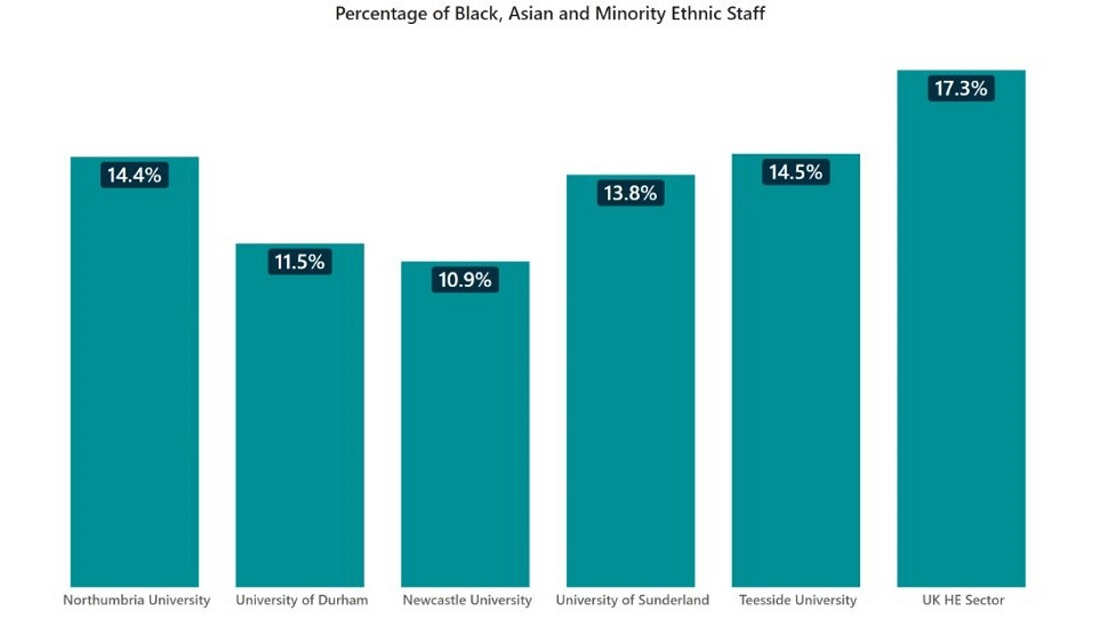
The proportion of Black, Asian, and Minority Ethnic staff at Northumbria has increased to 14.4% in 2024, up from 11.5% in the previous year. This places us above Newcastle (10.9%) and Durham (11.5%), positioning us as one of the more ethnically diverse universities in the region. The sector average has risen to 16.1%, reflecting a continued trend of increasing diversity across UK Higher Education Institutions.

The proportion of staff at Northumbria declaring a disability has increased to 3.8% in 2024, up from 0.9% in the previous year. While this rise is encouraging, it remains lower than both the regional and sector averages. Sunderland has the highest declaration at 11.0%, whilst the sector average stands at 6.9%. This upward trend at Northumbria is positive, but continued efforts are needed to improve support and further encourage staff to disclose disabilities.
Return to main EDI Report page.
Northumbria’s transformative strategic partnership with England Football Learning, the education…
Graduate businesses founded by Northumbria University students and alumni are generating an…

The governing body of UK Research and Innovation (UKRI) has visited Northumbria University…

Northumbria University has joined professional sports clubs, foundations and fellow universities…
Students from Northumbria Law School have returned from a four-day study visit to The Hague,…
A critically acclaimed dance production exploring the trauma of Australia's Stolen Generations…
The world-renowned art and technology festival is set to take place in the UK for the first…
A Northumbria University academic has been named Nurse Educator of the Year at the British…

The Banshee Pub
-
Squires Building

Stage 2
-

Northumbria University
-
