
As at 31 March 2024, the mean gender pay gap at Northumbria University is 11.4%, while the median gender pay gap stands at 15.8%. This represents a slight improvement compared to 2023, when the mean pay gap was 13.7%, though the median pay gap remains unchanged. The median gender pay gap is higher than the mean because of the positioning of the ‘middle’ man and ‘middle’ women in the pay structure, i.e. the ‘middle man’ sits in a higher grade.
Gender pay gap 2024
|
|
Mean |
Median |
|
Women |
£22.95 |
£20.72 |
|
Men |
£25.89 |
£24.60 |
|
£ difference |
£2.94 |
£3.88 |
|
Gender pay gap |
11.4% |
15.8% |
Table 1
Recent data from the government’s gender pay reporting portal also indicates that Northumbria’s gender pay gap is larger than that of other universities. For instance, Newcastle University reported a median pay gap of 14.3% (mean of 15.5%), and Sheffield Hallam University reported median gap of 12.2% (mean 9.3%), compared to 15.8% at Northumbria.
Gender pay gap 2021-2024
|
|
2021 |
2022 |
2023 |
2024 |
|
Mean gender pay gap |
12.3% |
11.4% |
13.7% |
11.4% |
|
Median gender pay gap |
16.0% |
15.2% |
15.3% |
15.8% |
Table 2
Progress in narrowing the University’s gender pay gap since 2021 has been slow. While the mean gap narrowed a little in 2022, it widened again in 2023. In the latest figures, it returned to its 2022 level, just 0.9 percentage points below the 2021 starting point. The median gap has remained persistently high, currently showing at only 0.2 percentage points below its level three years ago in 2021.
Northumbria University and UK gender pay gap 2021-2024
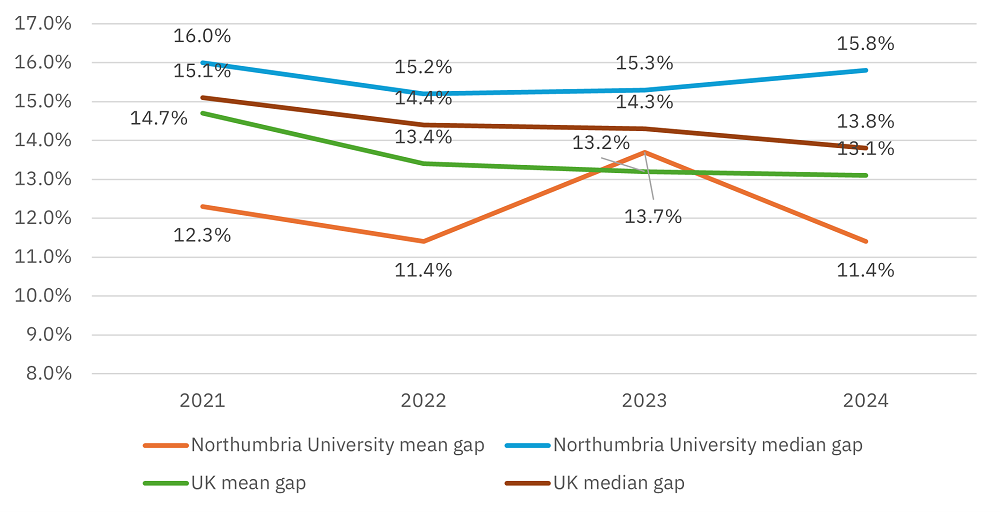
Figure 1 (Source: ASHE 2021, 2022, 2023, 2024, ONS).
View alt text for above images (figures 1 - 6)
Comparing progress on narrowing the pay gap at Northumbria shows that the mean gap has narrowed slightly but less than the UK, and its median gap has stagnated, indicating limited progress overall.
Pay quarters
Overall, women account for 54.8% of Northumbria’s workforce, but their distribution across the pay structure varies. Women are overrepresented in the lower and lower middle pay quarters (and the upper middle pay quarter, though there are more men here than in the lower half of the distribution), while men dominate the upper pay quarter. This uneven distribution across the pay quarters (vertical segregation) is a key driver of the gender pay gap, as women are concentrated in lower-paid roles and as a result have lower average pay than men.
Proportion of men and women in each pay quarter at Northumbria University
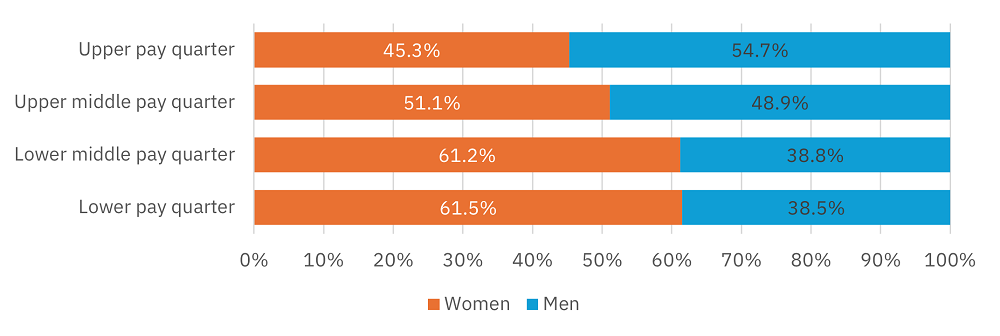
Figure 2
View alt text for above images (figures 1 - 6)
Gender pay gap by staff group
The gender pay gap at Northumbria varies between academic and professional support staff, reflecting differences in salary levels and workforce composition. Among academic staff, the mean gender pay gap is 7.0%, with no median pay gap (0.0%). In contrast, professional support staff have a lower mean pay gap of 3.4%, but a slightly wider median gap of 3.8%. However, both figures are narrower than the overall university gender pay gap, demonstrating that the main driver of the institution-wide gap lies in the distribution of men and women across academic and professional roles rather than within these categories themselves (horizontal segregation).
Gender pay gap by staff group 2024
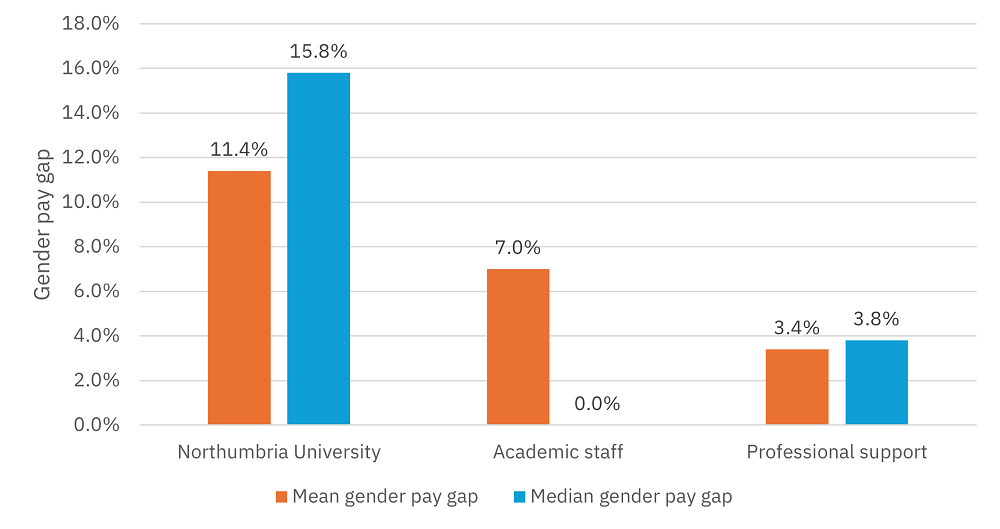
Figure 3
View alt text for above images (figures 1 - 6)
Gender pay gap by staff group 2024
|
|
Academic staff |
Professional support |
All staff |
|||
|
|
Mean |
Median |
Mean |
Median |
Mean |
Median |
|
Women |
£29.69 |
£29.01 |
£18.53 |
£16.88 |
£22.95 |
£20.72 |
|
Men |
£31.94 |
£29.01 |
£19.18 |
£17.55 |
£25.89 |
£24.60 |
|
£ difference |
£2.25 |
£0.00 |
£0.65 |
£0.67 |
£2.94 |
£3.88 |
|
Gender pay gap |
7.0% |
0.0% |
3.4% |
3.8% |
11.4% |
15.8% |
Table 3
The workforce composition further reinforces this trend. The majority of academic roles are held by men (52.3% men, 47.7% women), whereas professional support roles are predominantly occupied by women (39.3% men, 60.7% women). Because professional support roles typically have lower salary bands than academic roles, the higher proportion of women in these positions contributes significantly to the overall gender pay gap at the university. This structural imbalance, rather than direct pay disparities within job categories, remains a key factor influencing the university’s pay gap figures.
Proportion of men and women in academic and professional support roles
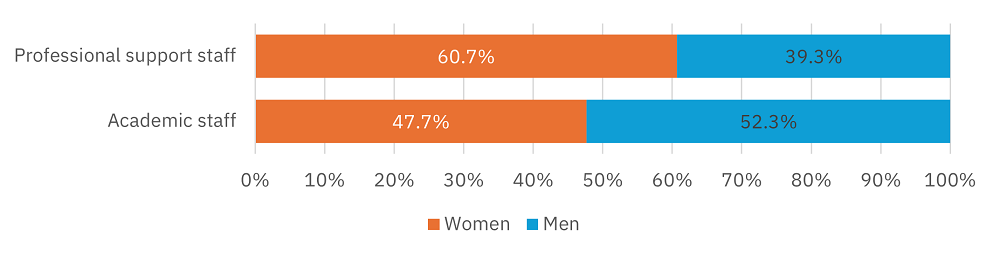
Figure 4
View alt text for above images (figures 1 - 6)
Gender pay gaps by Faculty/Service
Northumbria employs both academic and professional support staff across a number of Academic Faculties and Professional Services. Analysing the gender pay gap by department is essential because this approach uncovers disparities that may be masked by organisation-wide data. Analysis of the gender pay gap by department shows that in most cases the pay gaps are in favour of men, mean pay gaps are more often larger than median pay gaps, and the pay gaps are generally larger in smaller departments. These key trends are driven by combination of the types of roles men and women occupy in each department and an underrepresentation of women in higher-paid roles.
Northumbria University gender pay gaps by faculty/service
|
Faculty/Service |
Mean |
Median |
Employee count |
% women |
|
Strategy, Governance and Engagement (SGE) |
37.5% |
25.3% |
89 |
61.8% |
|
- Office of the Vice Chancellor |
55.1% |
67.0% |
13 |
30.8% |
|
- Strategy, Governance and Engagement Team |
3.9% |
12.0% |
76 |
67.1% |
|
Finance |
23.5% |
13.5% |
99 |
65.7% |
|
Faculty Operations (FO) |
11.7% |
18.7% |
88 |
53.4% |
|
Business and Law (B&L) |
10.9% |
0.0% |
386 |
47.2% |
|
Global Marketing and Business (GMB) |
10.9% |
6.3% |
292 |
69.5% |
|
Engineering and Environment (EE) |
10.4% |
11.6% |
504 |
34.7% |
|
Research and Innovation Services (RIS) |
6.9% |
0.0% |
74 |
64.9% |
|
Digital Tech and Transformation Services (DTT) |
6.8% |
7.5% |
182 |
20.3% |
|
Health and Life Sciences (H&LS) |
6.1% |
0.0% |
701 |
56.8% |
|
Campus Services (CS) |
-0.1% |
0.0% |
479 |
55.1% |
|
Arts, Design and Social Sciences (ADSS) |
-0.4% |
0.0% |
380 |
54.7% |
|
Student, Library and Academic Services (SLAS) |
-1.2% |
0.0% |
638 |
69.1% |
|
Human Resources (HR) |
-3.2% |
3.2% |
79 |
81.0% |
Table 4 (Note: excludes Funded Initiatives and Research Development Fund due to small samples).
The very wide gender pay gap in the Strategy, Governance and Engagement service is primarily driven by the Office of the Vice Chancellor team, a small group of leadership roles with a mean gap of 55.1% and a median gap of 67.0%. In contrast, the gender pay gap in the Strategy, Governance and Engagement Team within this service is much narrower (3.9% mean; 12.0% median). Similarly, the wide gap in the Finance team is influenced by the presence of senior leaders and the gender (im)balance in these roles.
The table below provides gender pay gap figures by faculty but with members of the University Executive extracted as a separate ‘department’ and their removal has a significant effect on the pay gaps in the Finance and SGE services. The very wide mean SGE gender pay gap reduces from 37.5% to 7.4%, and the median gender pay gap reduces from 25.3% to 15.6% once members of the University Executive are removed. Similarly, in Finance the mean gender pay gap reduces from 23.5% to 12.0%, while the median is unaffected.
Northumbria University gender pay gaps by faculty/service with University Executive extracted
|
Faculty/Service |
Mean |
Median |
Employee count |
% women |
|
Strategy, Governance and Engagement (SGE) |
7.4% |
15.6% |
79 |
67.1% |
|
Finance |
12.0% |
13.5% |
97 |
67.0% |
|
Faculty Operations (FO) |
11.7% |
18.7% |
88 |
53.4% |
|
Business and Law (BL) |
10.0% |
0.0% |
384 |
47.4% |
|
Global Marketing and Business (GMB) |
11.7% |
6.3% |
291 |
69.4% |
|
Engineering and Environment (EE) |
11.0% |
13.4% |
503 |
34.6% |
|
Research and Innovation Services (RIS) |
10.4% |
1.6% |
73 |
64.4% |
|
Digital Tech and Transformation Services (DTT) |
4.9% |
7.5% |
181 |
20.4% |
|
Health and Life Sciences (H&LS) |
6.5% |
0.0% |
700 |
56.7% |
|
Campus Services (CS) |
0.9% |
0.0% |
478 |
55.0% |
|
Arts, Design and Social Sciences (ADSS) |
0.3% |
0.0% |
379 |
54.6% |
|
Student, Library and Academic Services (SLAS) |
-0.7% |
0.0% |
637 |
69.1% |
|
Human Resources (HR) |
7.4% |
15.6% |
79 |
67.1% |
|
University Executive (ie Grade 10) |
22.0% |
21.4% |
23 |
43.5% |
Table 5 (Note: excludes Funded Initiatives and Research Development Fund due to small samples).
Gender pay gaps by grade
Analysis of gender pay gaps by grade shows that gaps are mainly minimal (and in one case negative in favour of women) until pay grade 10, where a significant pay gap emerges. The mean gender pay gap for grade 10 is 22.0% and the median is 21.4%, despite women accounting for 43.5% of staff in this grade (albeit a smaller population overall are at this level, accounting for just 23 staff in total, 10 women and 13 men).
Grade 10 is for the leadership group and includes the Vice Chancellor. As the highest-paid staff member, his pay has a significant impact on the gender pay gap since a very high salary for a single male employee at the top can disproportionately raise the average pay for men, especially if there are no similarly high-paid women to balance it out. Analysis of the gender pay gap for Grade 10 excluding the Vice-Chancellor shows that the mean gender pay gap narrows from 22.0% to 16.6%, while the median pay gap is unchanged at 21.4%. The mean gender pay gap at Grade 10 falls further to 15.8% when both the Vice Chancellor and Deputy Vice Chancellor are excluded.
Gender pay gaps by pay grade 2024
|
Pay grade |
Mean |
Median |
Employee count |
% women |
|
2 |
1.3% |
0.0% |
238 |
59.7% |
|
3 |
1.9% |
2.0% |
409 |
59.2% |
|
4 |
-7.3% |
3.7% |
118 |
44.1% |
|
5 |
1.0% |
1.6% |
741 |
62.3% |
|
6 |
4.0% |
0.8% |
665 |
61.8% |
|
7 |
0.4% |
0.0% |
1,004 |
48.8% |
|
8 |
0.4% |
2.9% |
283 |
43.8% |
|
9 |
1.7% |
0.0% |
274 |
33.2% |
|
10 inc. Vice-Chancellor |
22.0% |
21.4% |
23 |
43.5% |
|
10 exc. Vice-Chancellor |
16.6% |
21.4% |
22 |
45.5% |
|
10 exc. VC and Deputy VC |
15.8% |
21.4% |
21 |
47.6% |
Table 6
Gender pay gaps by length of service
Analysing the gender pay gap by length of service provides insights into how pay disparities evolve over time within the organisation and helps identify structural issues affecting pay equity. A structural issue refers to deeply embedded policies or practices that unintentionally favour one gender over another, such as unconscious bias in recruitment and promotions, lack of flexible or family-friendly policies, and barriers to advancing to senior roles.
Our analysis shows that the gender pay gap generally widens between men and women as service lengthens, suggesting that women may not be benefitting in the same way from opportunities for promotions, career advancement, or access to leadership positions.
The relatively large early-career gender pay gap between men and women in their first three years of service may highlight disparities in starting salaries, potentially stemming from differences in negotiation strategies or the types of roles men and women are being recruited into.
Gender pay gaps by length of service 2024
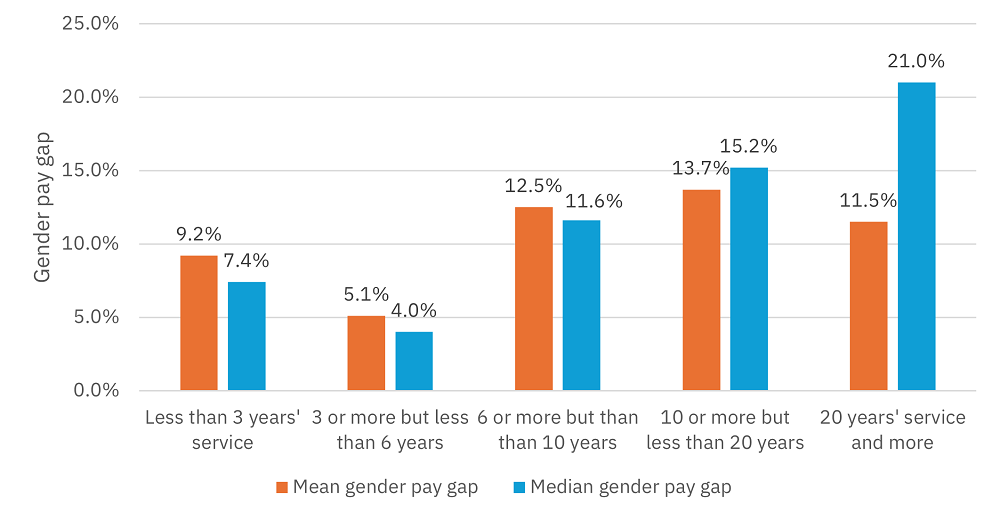
Figure 5
View alt text for above images (figures 1 - 6)
Gender pay gaps by age
Analysis of the gender pay gap by age shows that the gap is either minimal or even favors women until age 34. However, from this point onwards, a gap favoring men emerges and continues to widen with age, peaking at 38.4% between median pay for men and women aged 65 and over.
It is important to note that women outnumber men in all age brackets, but they are paid less on average overall and this worsens with age. This suggests that men progress at a faster rate throughout their careers compared to women.
Gender pay gaps by age 2024
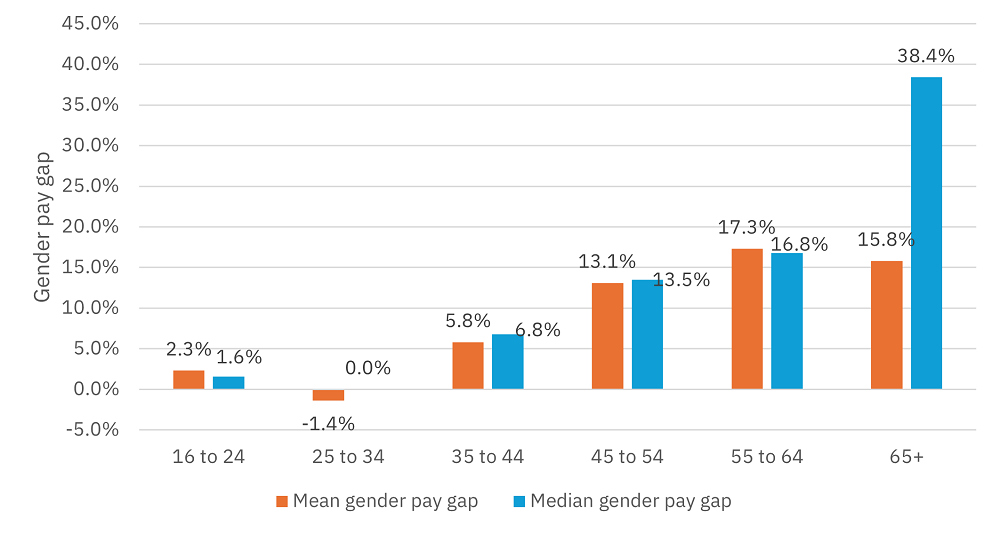
Figure 6
View alt text for above images (figures 1 - 6)
Bonus pay gap
Northumbria rewards colleagues via long service awards, and one-off recognition payments, via a scheme named ‘Going the Extra Mile’. Both sets of payments are considered as bonuses for gender pay gap reporting purposes. In total 142 women and 110 men received a payment, this represents generally equal proportions at 6.2% and 5.9% respectively.
The mean bonus gap is -30.8% in favour of women, which means the average bonus payment paid to women was higher than that paid to men, while the median bonus payment paid to men and women was the same, resulting in no bonus pay gap.
Bonus pay gap 2024
|
|
Mean |
Median |
|
Women |
£562.79 |
£100.00 |
|
Men |
£430.28 |
£100.00 |
|
£ difference |
-£132.51 |
£0.00 |
|
Bonus pay gap |
-30.8% |
0.0% |
Table 7
Intersectional pay gap analysis: gender and ethnicity
As gender and ethnic inequalities can overlap , we have conducted an ‘intersectional’ analysis to explore their combined impact. This analysis compares the earnings of a specific demographic group (e.g. ethnic minority women) with a reference group that serves as the baseline for comparison, typically the group with the highest earnings (e.g. ‘White’ men).
The following statistics suggest that ethnic minority women face additional pay disparities beyond those experienced by women as a whole, since the mean gender/ethnicity pay gap is wider than the overall gender pay gap – 15.0% compared to 11.4%.
Intersectional gender pay gap 2024
|
|
Gender/ethnicity pay gap |
Gender pay gap |
||
|
Mean |
Median |
Mean |
Median |
|
|
Northumbria University |
15.0% |
13.7% |
11.4% |
15.8% |
Table 8
[1] Analysis produced by UCEA based on provisional earnings data from Annual Survey of Hours and Earnings (ASHE) 2023, the median gender pay gap in higher education was 10.0%. This analysis has not yet been updated for 2024. According to Advance HE's ‘Show me the money – an exploration of the gender pay gap in higher education’ report, the median gender pay gap across the higher education sector was 11.9% in 2022.
You might also be interested in...
Latest News and Features
Northumbria University's IT recycling initiative recognised as national best practice
The equivalent weight of one and a half double-decker buses' worth of IT equipment has been…
Scientists solve decades-long mystery about why Saturn appears to change its spin
Researchers at Northumbria University have used the most powerful space telescope ever built…

Northumbria University professor named among UK's most outstanding health and care research leaders
A Northumbria University professor has been appointed as one of the UK's most influential health…
From campuses to communities: Newcastle's fifth Climate Change Forum forges greener future for city
Newcastle's fifth Climate Change Forum drew a full house – and an energising conversation about…

'Safer Stadiums' research shares women's experiences at men's football games
New research led by Northumbria University highlights the experiences of women who attend men's…

Free online directory launches to support people with experience of homelessness
Researchers at Northumbria University have launched a free, searchable online directory covering…

Northumbria University confirms multi-million investment in Centre for Writing and Publishing alongside commitment from North East Mayor
Newcastle is poised to become a major centre for the UK publishing industry after multi-million-pound…
Northumbria University delivers diverse programme of public engagement events for ESRC Festival of Social Science 2025
Northumbria University delivered fifteen innovative public engagement events as part of the…
More events
Upcoming events
North East CTEC Educator Conference 2026
Harvard Lecture Theatre 403
-

From sustenance to complete nourishment in a changing and uncertain climate
Ellison Building A, 001 (ELA 001)
-
