
Any Questions?
Our Applicant Services team will be happy to help. They can be contacted on 0191 406 0901 or by using our Contact Form.
Accuracy of information
All information is accurate at the time of sharing.
How your course is delivered
Full time Courses are primarily delivered via on-campus face to face learning but could include elements of online learning.
Changes to your course
Most courses run as described on our website and in our marketing materials. Occasionally we may need to make changes, for example due to a change in the law or regulatory requirements, requirements of a Professional, Statutory or Regulatory Body, or our quality assurance processes. Where a change is significant (in line with the Competition and Markets Authority's guidance on "substantial changes"), we will consult with affected students in advance where the change is being decided, and will explain the reason for the change and inform you at the earliest opportunity.
If we make a significant variation to your programme, you are entitled to: request a transfer to an alternative, appropriate programme; withdraw and have your tuition fees adjusted; or raise a complaint through the Student Complaints Procedure.
Optional modules listed on course pages may be subject to change depending on uptake numbers each year. Where a module you selected is withdrawn, the options above apply.
Contact time
Contact time is subject to increase or decrease in line with possible restrictions imposed by the government or the University in the interest of maintaining the health and safety and wellbeing of students, staff, and visitors if this is deemed necessary in future.
Images and video
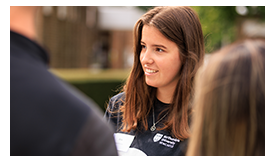
The photography and video on this page are used for illustration. They may have been taken at different times and in different parts of the University, and may show facilities, equipment, staff, students or activities that are not part of this course. They are not a guarantee of the specific facilities or equipment you will use.
The course content, entry requirements and fees sections of this page, together with the Programme Specification, set out what this course includes. Our facilities are updated over time and may change during your studies.
Accessibility and Student Inclusion
Northumbria University is committed to developing an inclusive, diverse and accessible campus and wider University community and are determined to ensure that opportunities we provide are open to all.
We are proud to work in partnership with AccessAble to provide Detailed Access Guides to our buildings and facilities across our City, Coach Lane and London Campuses. A Detailed Access Guide lets you know what access will be like when you visit somewhere. It looks at the route you will use getting in and what is available inside. All guides have Accessibility Symbols that give you a quick overview of what is available, and photographs to show you what to expect. The guides are produced by trained surveyors who visit our campuses annually to ensure you have trusted and accurate information.
You can use Northumbria’s AccessAble Guides anytime to check the accessibility of a building or facility and to plan your routes and journeys. Search by location, building or accessibility feature to find the information you need.
We are dedicated to helping students who may require additional support during their student journey and offer 1-1 advice and guidance appropriate to individual requirements. If you feel you may need additional support you can find out more about what we offer here where you can also contact us with any questions you may have:
Latest News and Features

New AHRC research shows how community innovation can power the next phase of devolution.
New research published today by the AHRC Creative Communities programme provides fresh evidence…

Free sessions to help families navigate the SEND system
Northumbria University's award-winning Student Law Office is launching SEND Decoded, a series…

New Doctoral Training Programme will tackle key polar science questions with a reduced carbon footprint
The Net Zero Polar Science (NZPS) Doctoral Training Programme (DTP) has welcomed its first…

New Student Health Hub brings joint health and wellbeing support
A new drop-in service is bringing health and wellbeing support for students at both Newcastle…

Researchers aim to grow optical fibres using biology instead of machinery
A new project led by Northumbria University aims to grow optical fibres using proteins, mimicking…

Training the next generation of space scientists
Northumbria University has hosted a major international workshop, bringing together leading…
More events
Upcoming events
Next Stop Northumbria
Europa Hotel
-
The Past We Inherit. The Future We Build: Better Decisions Happen Together
The Great Hall, Sutherland Building
-
Next Stop Northumbria
Manchester Marriott Hotel Piccadilly
-
