

Please note: Our 2023 Pay Gap data is presented on these pages; additional supporting information continues to be updated.
There is no statutory duty to analyse or report on disability pay, but the University now reports the Disability Pay Gap in line with our commitments to Disability Equality and our role as a Disability Confident Leader organisation. Our reporting of disability pay has been conducted using the same snapshot date as the gender and ethnicity pay gaps and uses the same inclusion criteria. Disabled staff are those employees who have voluntarily recorded in the online HR system that they have a disability, which will be lower than the total number of Disabled staff employed by the University.
The disability pay gap is reported as the difference between non-Disabled staff and Disabled staff, excluding where it is not known whether an employee is Disabled or not. A positive gap indicates a gap in favour of non-Disabled staff. Unlike the further analysis on five groups considered for the ethnicity pay gap, it is not possible to go beyond a comparison of Disabled and non-Disabled employees to look also at gaps by disability type, due to the number of categories, the smaller numbers of employees in each category and low disclosure of disability type. A full breakdown of the data can be found in appendix F.
| Year | Median % | Mean % |
| 2021 |
13.9 |
7.0 |
| 2022 | 15.8 | 10.6 |
| 2023 | 13.3 | 11.0 |
The proportion of full-pay relevant recorded as Disabled on the snapshot date has increased year on year from 2.5% (79) in 2021 to 3.4% (123) in 2023. This figure differs from the disclosure rate reported in EDI annual reporting, which uses the proportion of salaried employees, excluding employees with variable hours contracts, and uses a different reporting date.
The University continues to hold as a priority the importance of building a culture of trust in which Disabled employees feel comfortable to tell us about their disability. Although the number of Disabled employees is low, the Disability Pay Gap is statistically significant, meaning that it is unlikely that a higher disclosure rate will close the pay gap without understanding the underlying factors that contribute to the pay gap providing key insights to inform targeted action.
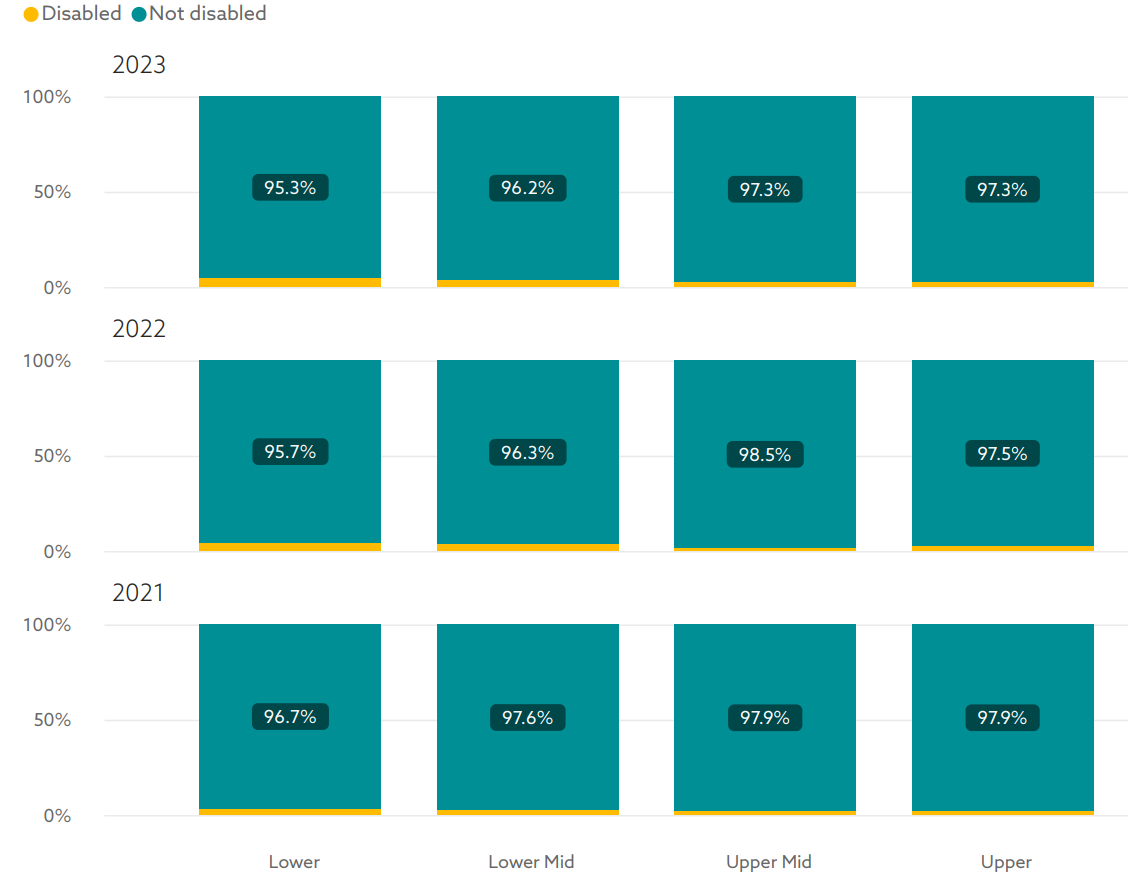
7. Disability Quartiles by Year, 2021 - 2023 (Full-pay equivalent employees, Northumbria University and Northumbria University Services Limited Excludes 'unknown' disability ('prefer not to say' or not recorded)
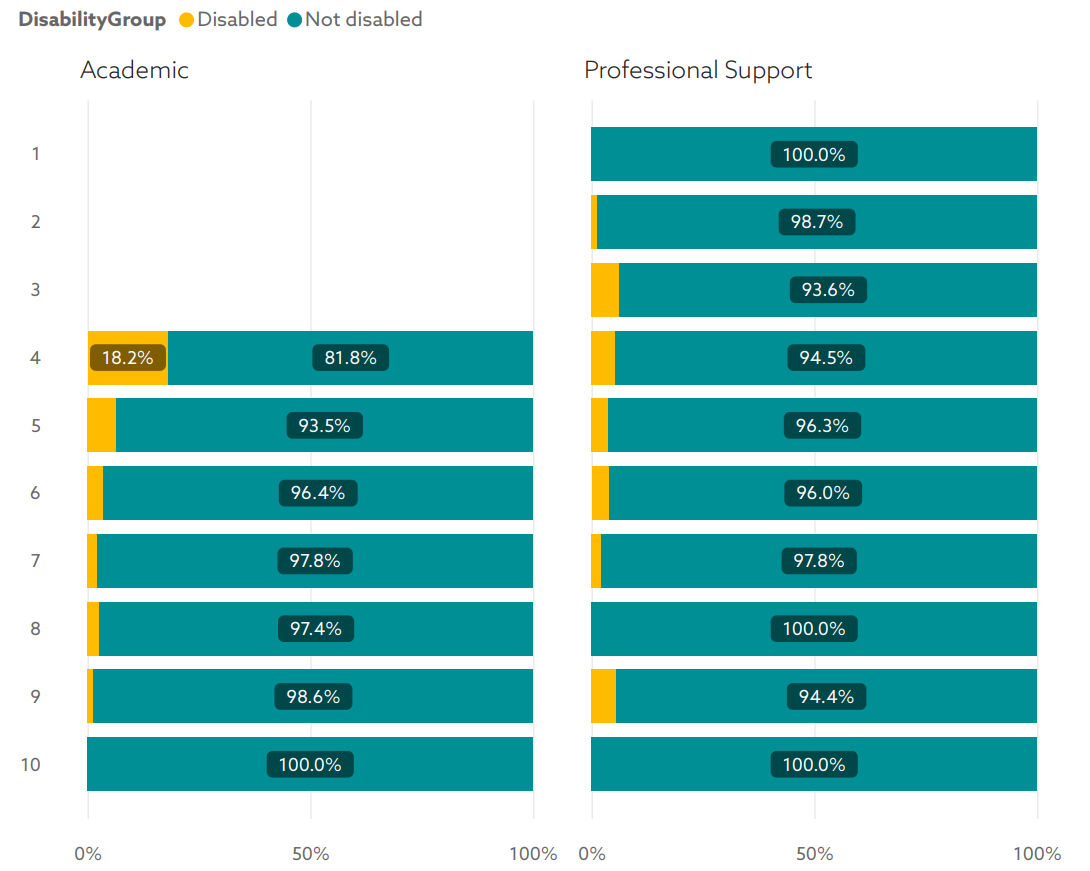
8. Disability by Grade and Employee Type, 2023 (Full-pay equivalent employees, Northumbria University and Northumbria University Services Limited Includes Grades 1 - 10, excluding KTPs and other grades outside the main pay spine. Values <5 are suppressed. Excludes 'unknown' disability ('prefer not to say' or not recorded)
The median Disability Pay Gap has decreased from 2022 and there has been an increase of less than a percentage point in the mean gap. The quartiles show little change between 2021 and 2023, with a higher proportion of Disabled employees in the lower and lower middle quartiles than in the upper middle and upper quartiles. While numbers are small (less than 10 for many grades) there is an evident decline in the proportion of Disabled full-pay relevant employees as grade increases. For Academic roles, between Grades 5 and 9 the proportion of Disabled employees reduces from 6.5% to 1.4%, and for Professional Support roles the proportion reduces from 6.4% at Grade 3 to 2.2% at Grade 7. However, the small numbers of Disabled employees in each group when split by type of role and grade makes it difficult to draw conclusions from changes in the distribution of Disabled employees through grades.
Back to top
